The real estate market in 2015 has started off with much enthusiasm
and the feel of an early active spring is upon us. While there are a
variety of factors contributing to these market trends, interest rates
trending downward is certainly a KEY factor (see January Blog for
analysis).
I thought it’d be interesting and insightful to highlight a few key
trends in some market areas and analyze what is actually taking place
from a data standpoint.
Roseville-
Overall homes for sale increased throughout 2014 peaking with a total
of 464 homes for sale in October. The number of homes for sale as of
January 2015 was 283. That is a drop of homes for sale by approx. 39%!
Auburn- Likewise, there was a similar trend in Auburn with homes for sale peaking approx. in October. Since, homes for sale have dropped by approx. 32%!
Christian Valley-Meadow Vista-Colfax- Regarding acreage properties in the $200,000 to $300,000 price range, there is ONLY a total of 8 listings currently available compared to 46 sales in all of 2014. There is HUGE shortage of homes in this price range!
Grass Valley- Both the median and average prices increased over the last 2 months in December and January!
Nevada City- Between April to September 2014, there was approx. 6-7 months of inventory available, which was a 2 year high. Over the past 3 months, inventory has dropped back to this 3-4 month range, which was the general inventory range back in 2013.
Lake of the Pines- The price per SF reached a one year high
in December 2014 at $204 per SF. Overall, the last 4 months have
maintained an upper price per SF trend compared to first quarter of
2014.
Summarizing, while the above trends are encouraging
heading into spring, it’s is very important to always look at your
subject property’s immediate neighborhood. Over the past few months
analyzing various neighborhoods, I’ve
observed some subtle different trends within neighborhoods. While the
real estate market has many strong indicators, price is still essential.
Buyers are more educated now that ever and generally won’t pay more for
a home listed above market value.
Real Estate Tip of the Month: More
lenders are now requesting appraisers verify and comment that carbon
monoxide detectors, smoke alarms, and double earthquake straps are
installed. This is regardless of refinances/purchases OR
FHA/conventional loans. Some lenders will condition to have corrected
prior to close of escrow or loan. It’s a good idea to have these items
checked prior to the appraiser inspection.
If your are interested in a free comparative market analysis (CMA) for your local neighborhood, contact me for details.
Bryan Lynch, Realtor
Direct: 530-878-1688
Cell/Text: 916-765-6785
Email: BryanLynchRE@gmail.com
www.BryanLynchRE.com
License#01790398
CURRENT REAL ESTATE ACTIVITY:
www.1375BooleRd.com
MLS#14060416 -SOLD 1/16/2015 FOR $599,000.
Disclaimer:
All information deemed reliable but not guaranteed. The information is
meant entirely for educational purposes and casual reading only and is
NOT intended for any other use.
Friday, February 20, 2015
Wednesday, January 14, 2015
Auburn CA Real Estate Slow Down? Nope.
As we enter 2015 in the Auburn CA real estate market, I've basically
learned that the real estate markets in general are less and less
predictable. For example, looking back, I heard interest rates were
supposed to rise, but going into 2015, they have done the opposite and
have dropped. Looking back over the last 2014 quarter in
Auburn, CA, I was curious if buyer activity slowed in the Auburn market
area heading into 2015 and found the opposite to be true.
Sales vs. Listings-
Regarding the number of homes on the market in Auburn (area 12301),
while the trend showed an increase from January 2014 to September 2014,
inventory has decreased since this September's peak while the total
number of sales have been stable. Will this trend continue or will
inventory level off? We'll have to wait and see.
Summarizing, Auburn did not experience the typical late fall/holiday seasonal slow down that can typically happen this time of year. On the contrary, the market was very active and robust in the Auburn CA market areas. I'm curious how this recent trend will continue as 2015 begins. Observing the market as a whole, the upward price trend has been short-lived and may be reflective of many buyers taking advantage of the more recent downward interest rate movement. While somewhat simplistic, I believe closely watching interest rates and the ratio of inventory vs. pool of buyers will give an indicator of where the market may head going forward into 2015 for not only Auburn, but many surrounding market areas.
If your are interested in a free comparative market analysis (CMA) for your local neighborhood, contact me for details.
Bryan Lynch, Realtor
Direct: 530-878-1688
Cell/Text: 916-765-6785
Email: BryanLynchRE@gmail.com
www.BryanLynchRE.com
License#01790398
CURRENT LISTINGS:
www.1375BooleRd.com
MLS#14012596 -PENDING SALE $599,000
Disclaimer: All information deemed reliable but not guaranteed. The information is meant entirely for educational purposes and casual reading only and is NOT intended for any other use.
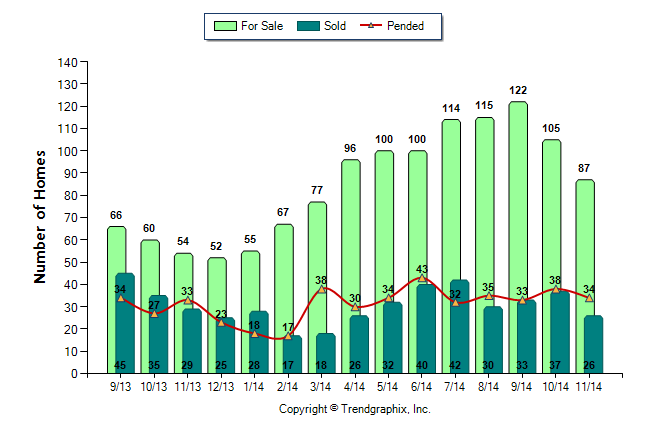 |
| Sales vs. Listings Auburn CA 2014 |
Median and Average Prices-
Regarding the Auburn average and median sales price, the graph shows
that these prices have been somewhat fluctuating and generally stable.
However, the average price has increased each month since September.
This coincides with the downward shift in inventory as noted above.
Sometimes the median and average charts can be impacted by a
disproportionate number of lower or higher priced sales. We'll soon find
out if this upward trend is short lived or will continue into early
spring.
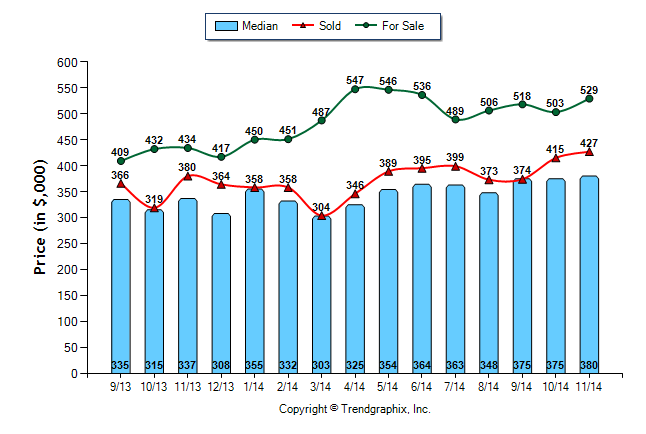 |
| Median- Average Prices Auburn CA 2014 |
Price per Square footage (SF)-
Further, it is always good to cross check data. I like to also look at
the price per SF analysis to verify if the median and average price
trends are consistent with each other. In this case, the price per SF
also increased since September. So, this graph coincides and supports
the median and average sales price graphs.
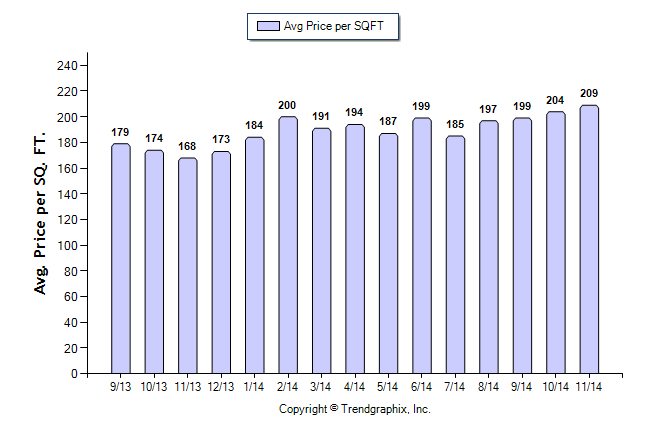 |
| Price per SF Auburn CA 2014 |
Summarizing, Auburn did not experience the typical late fall/holiday seasonal slow down that can typically happen this time of year. On the contrary, the market was very active and robust in the Auburn CA market areas. I'm curious how this recent trend will continue as 2015 begins. Observing the market as a whole, the upward price trend has been short-lived and may be reflective of many buyers taking advantage of the more recent downward interest rate movement. While somewhat simplistic, I believe closely watching interest rates and the ratio of inventory vs. pool of buyers will give an indicator of where the market may head going forward into 2015 for not only Auburn, but many surrounding market areas.
If your are interested in a free comparative market analysis (CMA) for your local neighborhood, contact me for details.
Bryan Lynch, Realtor
Direct: 530-878-1688
Cell/Text: 916-765-6785
Email: BryanLynchRE@gmail.com
www.BryanLynchRE.com
License#01790398
CURRENT LISTINGS:
www.1375BooleRd.com
MLS#14012596 -PENDING SALE $599,000
Disclaimer: All information deemed reliable but not guaranteed. The information is meant entirely for educational purposes and casual reading only and is NOT intended for any other use.
Monday, August 18, 2014
Market Trends and Comparisons- A Closer Look
As my recent blogs have talked about, I've observed a general
increase of inventory in most market areas. I thought it'd be
interesting to analyze specific communities and see what is happening
within each neighborhood to identify similar trends and differences.
Lake Wildwood and Lake of the Pines
Both communities are gated planned unit developments with HOA fees. Inventory has risen in both communities for extended months now (see charts). Lake Wildwood currently is ranging between 6 - 9 months of inventory! In addition, the overall median price has also decreased over the past 6 months from $300,750 to $240,000. There are possibly many factors that may go into this price decrease (a topic for another blog) but it does seem to indicate strongly that the market is shifting in this community.
Regarding Lake of the Pines, the overall median price has also decreased from $350,000 to $310,000 with inventory ranging in the 5 to 9 month range over the past 6 months.
I find it interesting that both gated communities are having similar downward median price trends. This will be something to watch closely as we enter fall.
Christian Valley/Auburn and Alta Sierra
Regarding the Christian Valley/Meadow Vista/Applegate market area (area 12302), inventory has been more of a slow upward trend from 2013 trough 2014 so far (see chart to the right). It appears that inventory was in the 3 month range as 2013 ended with inventory now in the approx. 5 month range. Over the last 6 months - the median and average price has been generally stable, which is a good sign of a healthy market.
There has been a similar trend within Alta Sierra. Inventory has gently increased within a healthy range similar to christian valley (area 12302) with median prices trending from $292,000 over the past 6 months compared to $280,000 over the 6 months prior. With such a slight percentage median price increase, this indicates more of a stable market at this time.
As we move from summer to fall, the balance between demand and supply will likely dictate where each market will trend going into fall and winter. Currently, pricing your home is more important than ever especially if you are located in a neighborhood where inventory is exceeding demand!
If your are interested in a free comparative market analysis (CMA) for your local neighborhood, contact me for details.
Bryan Lynch, Realtor
Direct: 530-878-1688
Cell/Text: 916-765-6785
Email: BryanLynchRE@gmail.com
www.BryanLynchRE.com
License#01790398
CURRENT LISTINGS:
www.1375BooleRd.com
MLS#14012596 - JUST REDUCED TO $669,000. EXTRAORDINARY. PRIVATE. UNIQUE. Enjoy treetop sunset views, year round pond and creek at your 7.1 acre foothills retreat!
Disclaimer: All information deemed reliable but not guaranteed. The information is meant entirely for educational purposes and casual reading only and is NOT intended for any other use.
 |
| Lake Wildwood Inventory |
Both communities are gated planned unit developments with HOA fees. Inventory has risen in both communities for extended months now (see charts). Lake Wildwood currently is ranging between 6 - 9 months of inventory! In addition, the overall median price has also decreased over the past 6 months from $300,750 to $240,000. There are possibly many factors that may go into this price decrease (a topic for another blog) but it does seem to indicate strongly that the market is shifting in this community.
 |
| Lake of the Pines Inventory |
Regarding Lake of the Pines, the overall median price has also decreased from $350,000 to $310,000 with inventory ranging in the 5 to 9 month range over the past 6 months.
I find it interesting that both gated communities are having similar downward median price trends. This will be something to watch closely as we enter fall.
 |
| Christian Valley(Auburn)/Meadow Vista/Applegate Inventory |
 |
| Alta Sierra (Grass Valley) Inventory |
Regarding the Christian Valley/Meadow Vista/Applegate market area (area 12302), inventory has been more of a slow upward trend from 2013 trough 2014 so far (see chart to the right). It appears that inventory was in the 3 month range as 2013 ended with inventory now in the approx. 5 month range. Over the last 6 months - the median and average price has been generally stable, which is a good sign of a healthy market.
There has been a similar trend within Alta Sierra. Inventory has gently increased within a healthy range similar to christian valley (area 12302) with median prices trending from $292,000 over the past 6 months compared to $280,000 over the 6 months prior. With such a slight percentage median price increase, this indicates more of a stable market at this time.
As we move from summer to fall, the balance between demand and supply will likely dictate where each market will trend going into fall and winter. Currently, pricing your home is more important than ever especially if you are located in a neighborhood where inventory is exceeding demand!
If your are interested in a free comparative market analysis (CMA) for your local neighborhood, contact me for details.
Bryan Lynch, Realtor
Direct: 530-878-1688
Cell/Text: 916-765-6785
Email: BryanLynchRE@gmail.com
www.BryanLynchRE.com
License#01790398
CURRENT LISTINGS:
www.1375BooleRd.com
MLS#14012596 - JUST REDUCED TO $669,000. EXTRAORDINARY. PRIVATE. UNIQUE. Enjoy treetop sunset views, year round pond and creek at your 7.1 acre foothills retreat!
Disclaimer: All information deemed reliable but not guaranteed. The information is meant entirely for educational purposes and casual reading only and is NOT intended for any other use.
Friday, June 20, 2014
Real Estate Slow Down? Factors Driving the Market-
We are hearing recent news about the slowing in sales volume
this spring and naturally the slowing has lead to questions of where is the
Real Estate Market heading? Let's face it - the real estate fall out (2007 to
2010) is not too far in the distant memory and volume of sales has slowed this
spring, inventory has increased, and prices seemly level following a general
period of extended appreciation. While I can't definitely state where the
market may be heading, it is a very honest and reasonable question to consider
the current market fluctuation and the recent shift in the market. Are prices
going to continue to rise? Why is inventory increasing? While there is not easy
answers to these questions, it's important to identify some basic
underlying factors of what drove the market prior to the 2007-2010 fallout
compared to today's market and monitor those factors in helping assess one's
position.
Real Estate Boom - Factors Then and Now:
The prior real estate boom that peaked generally in 2006 or so was driven by a multiple of reasons, one of which is known as the "wealth affect". Many homeowners took equity out of their homes to buy investment properties with aggressive loan programs and housing values increased and the cycle repeated for some time until ceiling hit and we all know the rest of the story. This time around, the recent increase in real estate values has not generally been driven by the "wealth affect" but more by large investment (hedge fund) companies, government related stimulus programs, historical very low interest rates, and for a period of time - an extreme shortage of inventory (less than 1 month of inventory in some areas). So the external factors driving the market are generally different from the prior housing boom.
While values have generally increased in Placer county the last few years - they are still below their 2006 year peak and tend to fall more in the 2008-2009 price range (see median and price per SF charts). Given the underlying factors, it's impossible to know exactly where the markets are heading in the short to long term. Will prices increase ? Stay flat ? Or even fall back? By following the above for mentioned external factors will help stay current on where the markets may be heading before it gets there. Sometimes the real estate news we read about is already "old" news when it's hits the print.
It is important to acknowledge that many real estate articles often talk about real estate markets in too broad of a stroke. For a clearer picture of what is happening in your local market, it's imperative to look at "your" specific market. There may be fluctuations and different trends from neighborhood to neighborhood. One thing is certain - accurately pricing your home in today's market is becoming more and more critical for a timely sale.
Bryan Lynch, Realtor
Direct: 530-878-1688
Cell/Text: 916-765-6785
Email: BryanLynchRE@gmail.com
www.BryanLynchRE.com
License#01790398
CURRENT LISTINGS:
www.1375BooleRd.com
MLS#14012596 - JUST REDUCED TO $719,000. High quality, custom built 3,822sf home located 7.1 acres with a park like setting and year round pond & creek and beautiful hilltop views. This property is a MUST see in person!
Disclaimer: All information deemed reliable but not guaranteed. The information is meant entirely for educational purposes and casual reading only and is NOT intended for any other use.
Real Estate Boom - Factors Then and Now:
The prior real estate boom that peaked generally in 2006 or so was driven by a multiple of reasons, one of which is known as the "wealth affect". Many homeowners took equity out of their homes to buy investment properties with aggressive loan programs and housing values increased and the cycle repeated for some time until ceiling hit and we all know the rest of the story. This time around, the recent increase in real estate values has not generally been driven by the "wealth affect" but more by large investment (hedge fund) companies, government related stimulus programs, historical very low interest rates, and for a period of time - an extreme shortage of inventory (less than 1 month of inventory in some areas). So the external factors driving the market are generally different from the prior housing boom.
 |
| PLACER COUNTY - MEDIAN PRICES 2006 - 2014 |
While values have generally increased in Placer county the last few years - they are still below their 2006 year peak and tend to fall more in the 2008-2009 price range (see median and price per SF charts). Given the underlying factors, it's impossible to know exactly where the markets are heading in the short to long term. Will prices increase ? Stay flat ? Or even fall back? By following the above for mentioned external factors will help stay current on where the markets may be heading before it gets there. Sometimes the real estate news we read about is already "old" news when it's hits the print.
 |
| PLACER COUNTY - AVERAGE PRICE PER SF- 2006 - 2014 |
It is important to acknowledge that many real estate articles often talk about real estate markets in too broad of a stroke. For a clearer picture of what is happening in your local market, it's imperative to look at "your" specific market. There may be fluctuations and different trends from neighborhood to neighborhood. One thing is certain - accurately pricing your home in today's market is becoming more and more critical for a timely sale.
Bryan Lynch, Realtor
Direct: 530-878-1688
Cell/Text: 916-765-6785
Email: BryanLynchRE@gmail.com
www.BryanLynchRE.com
License#01790398
CURRENT LISTINGS:
www.1375BooleRd.com
MLS#14012596 - JUST REDUCED TO $719,000. High quality, custom built 3,822sf home located 7.1 acres with a park like setting and year round pond & creek and beautiful hilltop views. This property is a MUST see in person!
Disclaimer: All information deemed reliable but not guaranteed. The information is meant entirely for educational purposes and casual reading only and is NOT intended for any other use.
Monday, May 19, 2014
How is the Real Estate market differing in Spring 2014 vs. 2013?
We are hearing recent real estate
news referencing sales and volume slowing this
spring compared to spring 2013. So what is happening and
impacting the market this spring compared to 2013? There are definitely some
external factors that have shifted. Below is a chart for all of placer county. As you'll see, active listings continue to increase with less sales. Comparing to spring 2013, inventory has essentially doubled.
It's important to understand
and dissect these factors influencing the real estate market to
be better understand where the market is today and possibly heading.
 |
| Placer county active listings - pending sales - closed sales |
Interest rates-
Interest rates will impact the cost
to borrow and ultimately impact the mortgage payment that one can afford
to pay. Since 2013, rates have generally slightly increased. Increased costs to
borrowers will impact the potential price range afforded and may ultimately
price out a buyer due an increased monthly payment.
Further, lending regulations have
continued to change and at times becoming more challenging for some borrowers
to obtain a loan. Josh Borba, broker associate with MLS mortgage in Auburn, states,
"Recent changes
to lending rules and regulations have made obtaining a new home loan a much
more difficult process. One of the main hurdles is that lenders are lending on
a lower debt to income (DTI) ratio. The good news is that although rates
are up slightly from a year ago, they are still extremely low which helps to
keep borrowers DTI lower so they gain greater purchasing power."
The future movement of interest
rates are impossible to predict but will ultimately have a significant impact
on the overall real estate market. We have been spoiled with cheap borrowing
costs the last few years, which in return, has stimulated the markets and
has ultimately contributed to real estate values appreciating over the past few
years while keeping monthly payments affordable.
Investors-
Cash investors have been
an integral part of the market the last few years. Large investment
companies like Blackstone have purchased homes in bulk quantities that has
contributed to the market recovery and contributed to less inventory
available on the market. With investor activity slowing more recently,
this is perhaps a gauge of how investors view current market conditions. The
fact that investor cash home purchases has slowed is likely an indicator that
perhaps they view home prices too high and/or not affordable anymore
compared to rental income received. Investors exiting the market has
contributed to the increase of inventory.
 |
| Placer County Inventory |
Buyer demand/inventory increasing-
Buyer demand is slowing (partially
due to reasons above), and consequently, inventory has increased. The above chart shows inventory essentially doubling compared to last year. The impact
of demand/supply is critical overall as gives a general indicator where
prices will move. When a shortage of inventory exists- prices will
generally increase upward (as we saw in 2013). In many areas- the markets were appreciating at double digit percentage in 2013. On the flip side, if there is an exceeding
over supply of homes on the market, prices will generally begin to decline as we
saw during the mortgage crisis many years ago.
Regarding the local markets I've analyzed, while remaining at healthy levels thus far, housing inventory has increased in many areas and median and average prices have shifted from increasing in 2013 to more level in 2014 (thus far). After this spring season passes, if buyer interest slows into the fall and inventory rises- we could see median and average prices slowly begin to drop down from current levels.
Conclusion-
I hope discussing the above factors helps give a better overview of the overall market conditions and begins to explain the difference between spring 2014 (thus far) vs. 2013.
Bryan Lynch, Realtor
Direct: 530-878-1688
Cell/Text: 916-765-6785
Email: BryanLynchRE@gmail.com
www.BryanLynchRE.com
License#01790398
CURRENT LISTINGS:
www.1375BooleRd.com
MLS#14012596 - High quality, custom built 3,822sf home located 7.1 acres with a park like setting and year round pond & creek and beautiful hilltop views. This property is a MUST see in person!
Disclaimer: All information deemed reliable but not guaranteed. The information is meant entirely for educational purposes and casual reading only and is NOT intended for any other use.
Regarding the local markets I've analyzed, while remaining at healthy levels thus far, housing inventory has increased in many areas and median and average prices have shifted from increasing in 2013 to more level in 2014 (thus far). After this spring season passes, if buyer interest slows into the fall and inventory rises- we could see median and average prices slowly begin to drop down from current levels.
Conclusion-
I hope discussing the above factors helps give a better overview of the overall market conditions and begins to explain the difference between spring 2014 (thus far) vs. 2013.
Again, it is important to understand that there are segmented markets within the overall market that are important to analyze (my April blog discussed this topic). If you are curious what the
value of your home is in today's market, contact me for a detailed comparative
market analysis (CMA).
Bryan Lynch, Realtor
Direct: 530-878-1688
Cell/Text: 916-765-6785
Email: BryanLynchRE@gmail.com
www.BryanLynchRE.com
License#01790398
CURRENT LISTINGS:
www.1375BooleRd.com
MLS#14012596 - High quality, custom built 3,822sf home located 7.1 acres with a park like setting and year round pond & creek and beautiful hilltop views. This property is a MUST see in person!
Disclaimer: All information deemed reliable but not guaranteed. The information is meant entirely for educational purposes and casual reading only and is NOT intended for any other use.
Monday, April 14, 2014
Spring Market- Who has the leverage- buyer or seller?
When considering selling or buying, there are many factors involved. One
important consideration is your competition on the market. The
importance of recognizing your home's segmented market identifying whether
a shortage, balance or over supply of homes exists will indicate and
demonstrate who has the potential leverage- the buyer, seller
or possibly both. Recently I analyzed price ranges for all SFRs from
Auburn through Colfax market areas using ONLY PRICE as the barometer.


Homes priced between $500,00 to $1,000,000 -

Homes priced $300,000 and below-
While
inventory has increased recently, current data still shows inventory to
be lower compared to the higher price ranges. Over the past 3 months,
pending sales have increased which is likely due to the Spring season. When supply is lower, sellers will generally have a slight advantage since
there is high buyer demand with fewer homes available. Sellers will
generally test the higher end of the price range in hopes in getting the
highest possible price. Buyers have to factor and weigh potential
competition among other buyers when submitting an offer or it may get
overlooked.
Homes priced between $300,000 to $500,000-
Current
data shows demand and supply fairly in balance in this price range. The
market activity also picked up in March with both an increase of
pending sales and active listings. From a seller and buyer
standpoint, both should have realistic market expectations understating
that generally neither side (buyer or seller) is in a strong position of
leverage in most scenarios.
Current data shows an over supply of homes currently available. Consequently, buyers will generally have an advantage since there is more
inventory available to choose from. If a home is listed higher
and/or over priced compared to competitors, the home will likely be
passed over as buyers look at lower priced homes. It is imperative for the seller to
pay close attention and monitor all active listings, pending sales and
recent closed sales to remain competitive.
While somewhat simplistic (and
putting aside other factors to consider), I hope the above helps give a general overview of current conditions based upon price range. It is HIGHLY important to
analyze your home's segmented market to help gain a better understanding of not only your home's value but your competition.
Contact me for any questions and if
interested in completing a comparative market analysis (CMA) for your
home.
Bryan Lynch, Realtor
Direct: 530-878-1688
Cell/Text: 916-765-6785
Email: BryanLynchRE@gmail.com
www.BryanLynchRE.com
License#01790398
CURRENT LISTINGS:
www.1375BooleRd.com
MLS#14012596 - High quality, custom built 3,822sf home located 7.1 acres with a park like setting and year round pond & creek. This property is a MUST see in person!
Disclaimer: All information deemed reliable but not guaranteed. The information is meant entirely for educational purposes and casual reading only and is NOT intended for any other use.
Wednesday, April 2, 2014
Welcome to Bryan Lynch Real Estate Blog
Welcome to Bryan Lynch Real Estate Blog:
For frequent posts, follow me on twitter and facebook.
https://twitter.com/BryancLynch
https://www.facebook.com/BryanLynchRE
For frequent posts, follow me on twitter and facebook.
https://twitter.com/BryancLynch
https://www.facebook.com/BryanLynchRE
Subscribe to:
Posts (Atom)